Accreditation

Questions about the accreditation of Johnston Community College may be directed in writing to the Southern Association of Colleges and Schools Commission on Colleges (SACSCOC) at 1866 Southern Lane, Decatur, GA 30033- 4097, by calling (404) 679-4500, or by visiting the SACSCOC's website.
Additionally, the College offers many programs that are accredited by various accrediting bodies which govern specific educational subject areas.
Student Achievement Data
The Southern Association of Colleges and Schools Commission on Colleges (SACSCOC) Principles of Accreditation Standard 8.1 addresses student achievement. Standard 8.1 requires the institution to identify, evaluate, and publish goals and outcomes for student achievement appropriate to the institution’s mission, the nature of the students it serves, and the kinds of programs offered, as well as utilize multiple measures to document student success.
Johnston Community College’s mission is to provide accessible, equitable, high quality educational and community enrichment opportunities for the successful development of learners. Therefore, JCC uses multiple measures of student achievement to analyze student success and primarily documents success with respect to student achievement through the North Carolina Community College System (NCCCS) Performance Measures Report and the National Student Clearinghouse 6-year Total Completion Rate.
North Carolina Community College System (NCCCS) Performance Measures for Student Success
Summary 2025 Performance Measures
The Performance Measures for Student Success Report is the NCCCS’ major accountability document. This annual performance report is based on data compiled during the previous year and serves to inform the colleges and the public regarding the performance of North Carolina’s 58 community colleges. Johnston Community College is committed to using these measures to continuously monitor, evaluate, and improve the quality of programs.
The 2025 performance measures for student success reports that Johnston Community College performed at or above the state average on all seven measures.
Threshold of Acceptability: The threshold of acceptability for all NCCCS Performance Measures is to meet or
exceed the average college percentage. 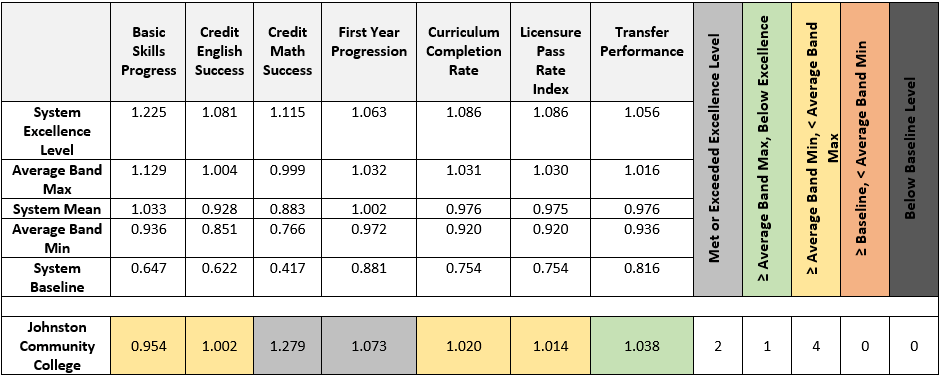
National Student Clearinghouse 6-year Total Completion Rate
The National Student Clearinghouse Completions Benchmark Report provides an institution-level
view of student completion rates benchmark to the analysis published in the national
signature report on completions. The report draws on Clearinghouse’s national coverage
of enrollment and awarded education credentials to explore the six-year outcomes of
a cohort of first-time-in-college degree-seeking students, who started in Fall 2012,
2013, 2014, 2016 and 2017. Note that reports from 2015 are currently unavailable.
Threshold of Acceptability: The threshold of acceptability for the 6-year Total Completion Rate is to meet or
exceed the national average overall completion rate.
The table below shows Johnston Community College data compared to national benchmarks for other two-year institutions. Since 2012, JCC’s completion rate has been consistently higher overall than the national benchmark.
National Benchmark: Six-Year Outcomes and First Completion for Students Who Started at Two-year Public Institutions vs. Six-Year Outcomes and First Completion for Students Who Started at Johnston Community College
| Demographics | 2017 (National) | 2017 (JCC) | 2016 (National) | 2016 (JCC) | 2014 (National) | 2014 (JCC) | 2013 (National) | 2013 (JCC) | 2012 (National) | 2012 (JCC) |
|---|---|---|---|---|---|---|---|---|---|---|
| Overall | 43.35% (711.940) | 55.41% (496) | 42.08% (721,089) | 49.82% (470) | 40.28% (772,884) | 46.55% (499) | 40.76% (757,646) | 43.29% (537) | 39.22% (752,206) | 47.46% (532) |
| Men | 41.01% (328,311) | 53.29% (284) | 40.82% (355,518) | 48.82% (209) | 38.46% (351,141) | 49.82% (219) | 38.88% (342,333) | 34.22% (243) | 37.48% (336,945) | 51.48% (229) |
| Women | 46.86% (352,278) | 56.99% (284) | 46.31% (354,826) | 50.63% (261) | 43.41% (382,516) | 44.00% (280) | 43.96% (342,333) | 52.36% (285) | 42.31% (372,117) | 46.88% (285) |
| Asian | 53.78% (32,975) | 57.14% (7) | 53.41% (33,988) | 60.10% (5) | 51.07% (33,974) | 85.78% (7) | 49.87% (31,416) | 100% (4) | 49.06% (27,281) | 50.00% (2) |
| Black | 31.85% (85,610) | 33.14% (57) | 31.10% (84,802) | 34.02% (53) | 28.16% (93,895) | 22.52% (67) | 28.77% (92,611) | 19.12% (95) | 27.54% (88,407) | 42.96% (96) |
| Hispanic | 38.04% (162,092) | 59.08% (88) | 37.86% (157,398) | 61.21% (67) | 36.10% (149,289) | 40.58% (74) | 37.06% (135,715) | 52.32% (65) | 35.73% (110,457) | 46.35% (41) |
| White | 51.1% (307,883) | 59.44% (318) | 50.55% (309,840) | 51.74% (294) | 48.74% (328,500) | 52.19% (280) | 49.23% (330,358) | 46.78% (332) | 48.08% (317,704) | 49.11% (363) |
| Other | 45.62% (14,517) | 40.00% (5) | 47.30% (18,675) | 50.00% (8) | 43.14% (18.193) | 37.50% (8) | 44.28% (19,337) | 50.00% (10) | 41.78% (15,724) | 66.67% (3) |
| Two or More Races | 40.9% (26,495) | 36.42% (11) | 39.95% (26,403) | 30.00% (10) | 38.02% (26,675) | 0% (-) | 39.75% (23,451) | 0% (-) | 39.33% (20,029) | 0% (-) |
| Race / Ethnicity Unknown or Missing | 34.15% (82,368) | 50.00% (10) | 33.94% (89,982) | 39.39% (33) | 29.04% (122,357) | 50.81% (63) | 28.64% (124,757) | 51.39% (31) | 29.35% (172,604) | 40.75% (27) |
| Asian Men | 49.63% (15,561) | 33.33% (3) | 49.50% (16,096) | 50.00% (4) | 47.34% (15,796) | 100% (4) | 46.22% (14,489) | 100% (1) | 46.14% (12,802) | 100% (1) |
| Asian Women | 60.04% (14,959) | 75.00% (4) | 59.77% (15,245) | 100.00% (1) | 56.72% (15,061) | 66.67% (3) | 55.58% (13,830) | 100% (3) | 54.49% (11,921) | 100% (1) |
| Black Men | 29.56% (37,823) | 34.33% (32) | 29.36% (37,486) | 35.71% (28) | 26.38% (40,583) | 22.22% (27) | 27.00% (39,844) | 10.48% (48) | 25.76% (37,428) | 49.75% (46) |
| Black Women | 34.65% (42,796) | 31.65% (25) | 33.87% (42,588) | 32.12% (25) | 31.01% (47,395) | 22.73% (40) | 31.65% (46,477) | 31.19% (42) | 30.27% (44,847) | 41.38% (42) |
| Hispanic Men | 33.69% (72,072) | 62.47% (24) | 33.69% (70,451) | 50.00% (2) | 32.41% (65,851) | 41.48% (29) | 33.42% (59,389) | 36.36% (22) | 32.17% (48,109) | 47.06% (17) |
| Hispanic Women | 42.39% (85,598) | 57.81% (64) | 41.96% (82,870) | 65.97% (47) | 39.76% (79,094) | 40.00% (45) | 40.67% (72,052) | 60.48% (43) | 39.21% (59,102) | 45.85% (24) |
| White Men | 48.72% (147,998) | 56.83% (139) | 48.43% (150,813) | 52.30% (132) | 46.61% (156,078) | 55.00% (131) | 47.04% (155,938) | 39.79% (156) | 45.80% (148,924) | 51.93% (156) |
| White Women | 54.01% (151,645) | 61.46% (179) | 53.22% (151,369) | 51.28% (162) | 51.43% (164,020) | 49.72% (149) | 51.96% (165,573) | 53.57% (174) | 50.81% (160,397) | 48.63% (200) |
Table Notes:
- Outcomes include first degree or certificate completion.
- Students with missing gender data are excluded. As a result, the total of the subgroup numbers may not equal that of the overall number. Because of coverage weighting, some rates may not appear in the data tables as whole numbers.
- The race/ethnicity categories included in the national signature Completions report are White Non-Hispanic, Black Non-Hispanic, Asian, Hispanic, Two or More Races, Other Races, and Unknown. The Other Races category includes non-resident alien, American Indian or Alaskan native, Pacific Islander, and native Hawaiian or other Pacific Islander. Of these race/ethnicity categories, only four races (Asian, Black, Hispanic and White) are included in the comparable table in the NSC report as they are the most frequently reported races.
Quality Enhancement Plan (QEP)
JCC’s quality enhancement plan (QEP), PACE Yourself, focuses on first-year student progression and gateway English and math course completion. Initiatives include early intervention efforts for student retention, professional development for gateway course faculty, and mentoring for first-year students.
The QEP ties student success to progression and retention to increase JCC students’ (1) first-year progression, (2) success in gateway English courses, and (3) success in gateway math courses. If you would like to learn more about JCC’s QEP, please contact Amanda Zekanis at ajzekanis@johnstoncc.edu.